Posts

Showing posts from February, 2020

Introduction To Business Analytics And Operational Research Solution Methods, Including Decision Analysis, Linear Programming, Inventory Control, Simulation And Markov Chains – Statswork
Image
In modern years, there is a growing demand in the field of  business analytics . It actually means that what outcome we should get in business from the data to make better decisions. This is often sound like relating a business problem to an operation research problem. However, there is often a question that arises in connecting the business analytics to the operation research problem. In this blog, I will explain to you the meaning of business analytics and how it is related and useful in the operation  research methods  or decision making including linear programming, inventory management, simulation, and Markov Chains. Analytics are used to identify (i) what has happened? (ii) What should happen? And (iii) what will happen? In the business. These three forms of question are categorized into  Descriptive, Prescriptive and Predictive analytics  respectively. Apart from the benefits and uses of business analytics, the main goal of business analytics is to identify which dataset wi
What Approach Should I Take: Qualitative Or Quantitative – Statswork

Image
Posted by u/statswork just now What Approach Should I Take: Qualitative Or Quantitative – Statswork In practice, Data collection and Data Analysis involves two approaches: Qualitative and Quantitative approaches. Each approach has diverse kinds of objectives and statistical methodology.  Quantitative research Methodology  is useful in testing the assumptions and theories which are already Qualitative research is useful in understanding the concepts and formulating the theories.  Experimental research and surveys  are examples of quantitative research. Quantitative Research It focuses on testing the hypothesis we claim about the problem. Expressed by numbers, tables, and graphs Needs many observations The questionnaire should be in closed form i.e. with multiple-choice questions Qualitative Research It focuses on developing and formulating a hypothesis Expressed by words or text Needs a few observations The questionnaire may be

7 Excellent Reasons Why Statistics Are Important - Statswork

Harry is a pizza shop owner, and he’s perplexed to prefer a better location among two locations that he already shortlisted. He created up his mind to conduct a study to opt for the quintessential area. Location A is narrow, and he notices that there’s a high school two blocks away, some business offices accessible, and a Laundromat not far away. Location B is more extensive and next to a market with some business offices scattered around the space, amidst many vacant tons. If you were Harry, which might you choose? Mark Twain once quoted, “FACTS ARE STUBBORN THINGS, BUT  STATISTICS  ARE PLIABLE.” You are a  statistician  in many ways. Statistics is that the technique of conducting a study of a couple of specific topics by aggregation, organizing, decoding, and eventually presenting data. Statistics are used to analyze what’s happening within the world around us. In this data-driven world, all activities of ours are monitored by someone else every time. Statistics hold a key posi

Explain and Execute Statistical Design and Analysis of Two Variable Hypothesis - Statswork

Image
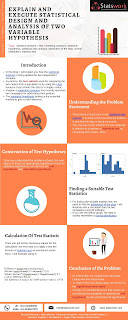
In this blog, I will explain to you how the  statistical analysis  is being applied for two independent samples. In practice, the test statistic used for comparing the two means from a population is by using the  t-test  because t-test shrinks the data to a single t-value and it is then compared with the significant value for the final conclusion. Now, let us understand the theoretical background in performing the t-test for two variables. Suppose X1 and X2 be the two independent random variables and let, be the sample with size n1 and n2 from a population with mean µ1, µ2 and variance σ12, σ22 respectively. Understanding the Problem Statement The primary or basic task in any  statistical data analysis  is to know or find out what the problem is and how the data is being measured. Construction of Test Hypotheses Once you understand the problem at hand, the next step is to frame an appropriate hypothesis to test for  statistical significance ; we call it as the nu

Research Design Decisions and be competent in the process of reliable data collection and analysis

Image
Research Design services may be described as the researcher’s scheme of outlining the flow of his project. It is based on research design, that the researcher goes about gathering data to answer his research question . The plan of the project, namely the planning for the materials and the logistics involved follows this. Similarly, in research as well, the researcher chooses his Data Collection process based on his Research design decision. It enables the researcher to prioritize his work, create better questionnaires and arrive at conclusions with greater clarity. were used for the same. For instance, Key informant interviews and Project records were used for collecting information on the quality of the implementation. Quantitative research design may be sub-divided into experimental, Quasi-experimental, Survey and Correlational, while, Qualitative research may be divided into Ethnography , Case study , Historical and Narrative. Data Collection Techniques and How to c

Panel Data Analysis: A Survey On Model-Based Clustering Of Time Series - Statswork

Image
The clustering technique in  Statistical Analysis  is used to determine the subsets as clusters in the data using the specified distance measure. However, this technique cannot be applied easily for longitudinal or time-series data. In this blog, I will discuss some of the methods used for modeling longitudinal or panel data using the  Clustering Analysis  technique as explained in Schmatter (2011). Longitudinal data is actually a sample of observations which are measured repeatedly over time. And, nowadays, longitudinal/repeated measure data or panel data exists in all areas of  Applied statistics  such as finance, psychology, economics, and social sciences. Most studies deals with analyzing homogeneity in such  Time series data  (Diggle et al 2002), however, there are few researchers’ shows interest in analyzing the heterogeneity in such data and they proposed different modeling technique for the same. Let us now discuss the applicability of the model-based clustering techniq