COMPARISON OF MULTILEVEL MODEL AND ITS STATISTICAL DIAGNOSTICS
COMPARISON OF MULTILEVEL MODEL AND ITS STATISTICAL DIAGNOSTICS
Diagnostics in Statistical Analysis is atmost important because there may be few influential observations which may distort the inference of the problem statement at hand. It is to be noted that all influential observations are not outliers, but some outliers are influential. In this blog, I will point out few standard statistical diagnostics in multilevel data.
Multilevel data and its diagnostics
Multi-level models are the statistical models of parameters (like in usual linear regression model) that vary at more than one level. It is also referred with many terms, namely, mixed-effect models, random effect model, hierarchical models and many more. In recent times, with the advent of statistical software and computations, multi-level or hierarchical models are widely used for longitudinal repeated measures analysis and in many meta data applications. Multi-level models could also applicable for non-linear case too by using appropriate Generalized Linear Mixed Models.


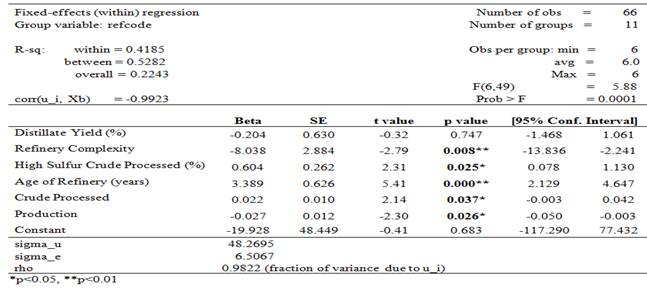
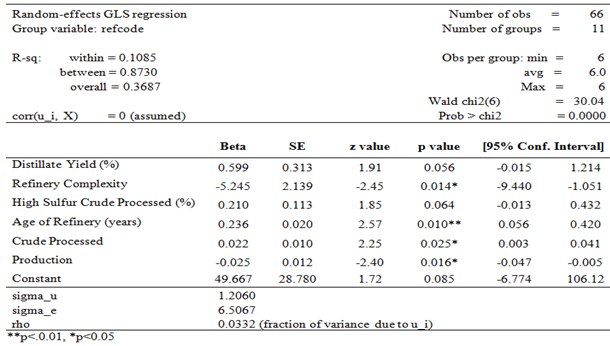
Table shows the hierarchical model

Like in Linear Regression Model, the mixed model also must satisfies the assumptions of the model. If any one of the assumptions is violated, then the data is taken to the diagnostics part of the model. Mostly, researchers checks the data for the independence. If it gets violated, then the most popular residual diagnostics is carried out to identify the influential or outlier points which deviate from other.

Table showing the linear regression between Attractiveness and Purchase Intention

Table showing the R, R-Square and Adjusted R-Square

Table showing the residuals of linear regression

However, residual diagnostics in the multilevel models needs careful attention. As a Statistical Analysis practitioner, I prefer to fit a level 1 (with one independent variable) regression model with and without the influential points and compare the plots of the residuals. Later, I will go for level 2 regression model and cross check the results. In addition, bootstrapping technique with jacknife residuals can also be useful in diagnosing the multi-level model for greater accuracy.
Table showing the multiple regression analysis which is used to predict one dependent variable based on more than one independent variable

There are many software packages available in R for diagnosing a multi-level model and present a graphical display for easy reference. Few among them are:
1. residplot — is used for linear mixed model diagnostics
2. DHARMa — is used for residual diagnostics of GLMMs.
3. HLMdiag — is used for diagnostics for hierarchical models
Misspecification is a major problem when using usual residual statistics such as Pearson and Response in the multi-level modelling. However, DHARMa package overcomes this limitation and gives a straightforward method as in linear regression models. If there exists a unusual pattern in the data, it can be identified using the residual vs the predicted plots.
HLMdiag package allows the user to obtain the residuals through least square estimates or bayes estimates. Also, it allows the user to obtain various residuals using marginal, conditional distributions. Furthermore, it provides deletion diagnostics with the help of distance based metrics such as Cook’s distance, COVratio, COVtrace and MDFFITS.
Apart from residual diagnostics, Lindsey and Lindsey (2000) proposed a diagnostic tools for random effects model with an application to growth curve model. Snijders and Berkhof (2007) explained the diagnostics for multilevel models in a more concrete way. Also, Shi and Chen (2008) illustrated a case deletion diagnostics in multilevel models for identifying the influential observations in the data.
There have been a lot of applications emerging for multilevel regression models especially in the Meta Data and it became a common practice in the field of statistics to make the model more accurate. In general, multi-level models are nested with more groups like colleges, lecture rooms, and country. Suppose, if we consider a comparative study using the variable country, it is obvious that there will be limited number of observations exists. This type of measurements easily influence the outcome from a regression model. Thus, more appropriate diagnostic measures are to be selected with the suitable model in validating the multi-level regression results with greater accuracy.
Reference:
1. Goldstein, H. (2003). Multilevel statistical models. Third Edition. London: Edward Arnold.
2. Browne, W. and Rasbash, J. (2004). ‘Multilevel Modelling’, in Hardy, M. and Bryman, A. (eds.), Handbook of data analysis, Sage Publications, pp 459–78.
3. Christensen, R., Pearson, L.M., and Johnson, W. (1992) “Case-Deletion Diagnostics for Mixed Models, Technometrics, 34, 38–45.
4. Snijders and Berkhof (2007), Diagnostic checks for multi-level models. Handbook of Multilevel Analysis. Springer.
5. P.J Lindsey and J.K Lindsey (2000) Diagnostic tools for random effects in the repeated measures growth curve model. Computational statistics and Data Analysis, 33, 79–100.
6. Shi and Chen (2008). Case Deletion Diagnostics in Multilevel models, Journal of Multivariate Analysis, 99, 1860–1877.
Comments
Post a Comment